
What is Correlation? The Global Correlation of Indices?
Do stocks, bonds, and commodities generally move in tandem across the globe? Does strength in the U.S. S&P 500 index generally help buoy indices in Japan and Europe? While there is a correlation between indices, the movement is not in lockstep. Global indices are correlated, but the action can be delayed based on the economics in each country.
What is Correlation?
Correlation is a statistical term that describes how two or more assets move relative to one another. This statistic can be helpful if you engage in online trading as CFDs as it might explain how the asset you are focused on will react to the movement of another asset. The correlation will describe the strength of a relationship between two or more assets and be reflected by the correlation coefficient.
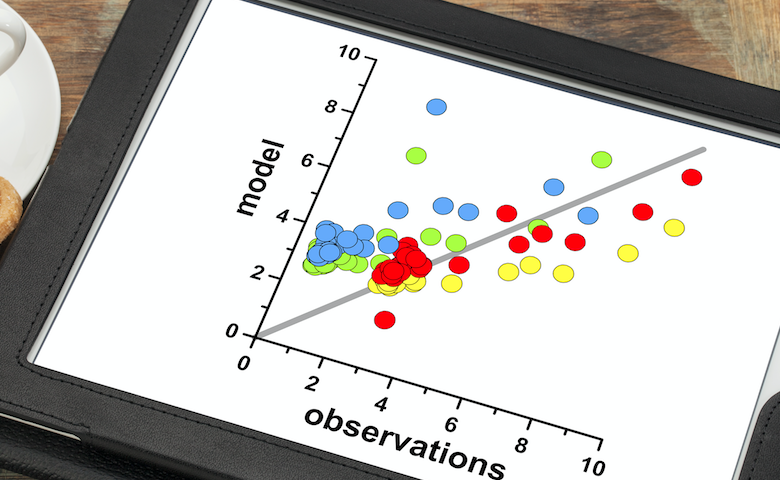
The correlation coefficients range from -1.0 (-100%) and 1.0 (100%). A correlation coefficient of 1 means that the two assets you are measuring show returns that move in tandem perfectly. A correlation coefficient of -1 means that the returns of the two assets move in opposite directions. When you calculate a correlation, you need to correlate the returns or the log of the assets. If you correlate the price, you will not determine if the movements change in tandem.
Why are Correlations Used to Evaluate Indices?
The calculations of correlations play a crucial role in portfolio management because they can assist in deriving the future move of an index. For example, if you are trading the price of an index in Japan, such as the Nikkei, you might consider how correlated that index is to the S&P 500 index. If you see a significant move in the S&P 500 index but initially not a correlated change in the Nikkei, this might alert you that the shift in the index you are online trading might be coming soon.
How to Use Correlation with Pair Trading
One of the most active ways to use correlation with online trading as CFDs is through pair trading. Pair trading is a market-neutral strategy used to take advantage of a breakdown in the correlation of two assets. A pair online trading strategy begins with analyzing two or more assets such as indices or stocks. You want to find two assets that are historically highly correlated with one another. Once you find these assets, you want to follow their movements and wait for a period where they decouple from each other. The decoupling of the movements occurs when the correlation between the two assets breaks down. This scenario can provide an online trading opportunity by which you can open a “buy” deal for one of the assets and simultaneously a “sell” deal for the other.
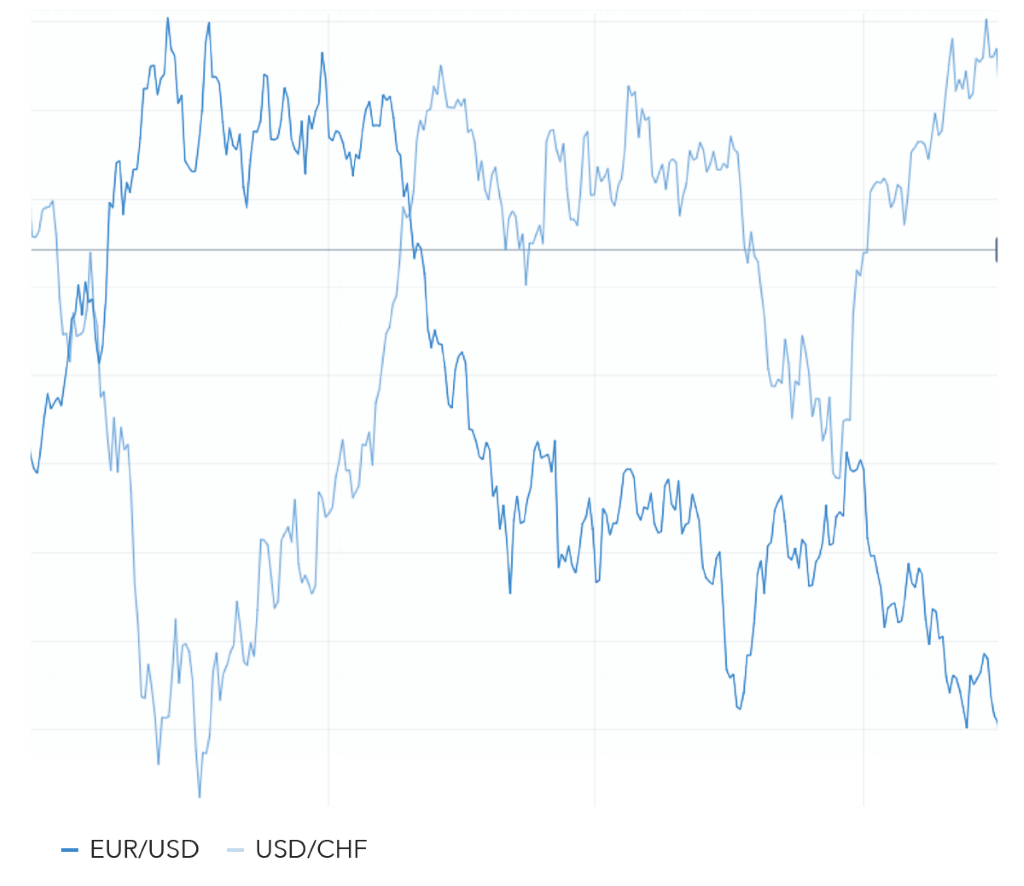
The goal of the pair trading strategy is to generate revenue from the breakdown in the correlation and wait for the two assets to eventually move in tandem with each other as one asset catches up to the movements of the other asset. This online trading strategy is called a market-neutral strategy because you are not taking a position in the market direction. Instead, you are taking a view on one index versus another index.
Why are Global Indices Correlated?
The movements of global indices generally move in tandem as they relate to developed countries. Emerging country indices are usually more focused on the nuances of their country’s economic outlook. Since growth in the developed world usually moves in tandem, it’s essential to track the movements of these indices and see if they are correlated if you plan to engage in online trading as CFDs.
Global indices usually move when the economic outlook changes. When interest rates begin to decline, ahead of global growth, stock prices generally move higher. As global economic growth expands, stock index prices may continue to accelerate higher. When global interest rates start to rise to reduce inflationary pressures, stock indices can begin to level off and eventually move lower. By following the movements of indices that are correlated, you can be prepared for each index’s positive and adverse movements based on the actions of the index that they follow at times.
The Bottom Line
Indices around the globe are generally correlated with the stock indices in the developed world. For example, you will find that the S&P 500 index is relatively correlated with DAX over time. The term correlation refers to the movements of two assets. If they move in tandem with one another, the correlation between the two assets will be close to 100%. If they move in opposite directions, then the correlation is deemed to be close to -100%. There are several strategies that you can use when you engage in online trading of CFDs that center around correlation. Pair trading is one of those strategies, and it takes advantage of the relative performance of one asset to another. Correlation is an important statistic if you are trading CFDs and could help you determine the future movements of your tracking assets.
FinancesGlad is India’s fastest growing online publication Blog for Entrepreneurs, Small business, Bloggers and personal finance experts.